
2026 Second Half Outlook
The first half of 2026 was eventful to say the least. We expect the second half to be no less eventful. We believe developments relating to geopolitical conflicts, financial and technological innovation and the policy impacts felt from the lead-up to, and results of, the US mid-term elections will foster continued market volatility and create a rich environment of exploitable alpha opportunities in each of our focus areas; Rates, Mortgages (MBS) and Credit.
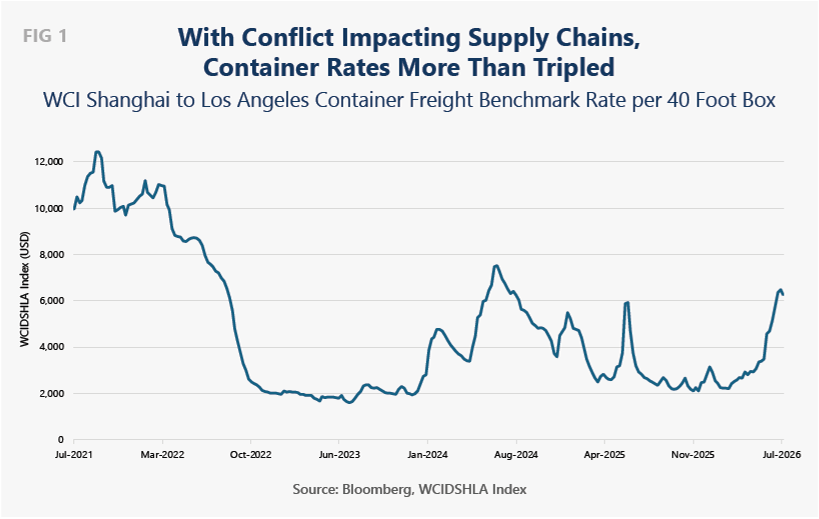
Conflict, in the form of the wars in Ukraine and Iran took center stage through the first half impacting many pieces of the investing puzzle and we expect that to continue. One major effect has been the impact on commodity prices, especially the price of oil, pressuring inflation expectations globally. Additionally, trade route disruption and its negative impact on supply chains have added to uncertainty. One symptom of said disruption can be seen in container rates. The chart (FIG 1) shows Shanghai to Los Angeles rates which have more than tripled since the Iran conflict broke out.
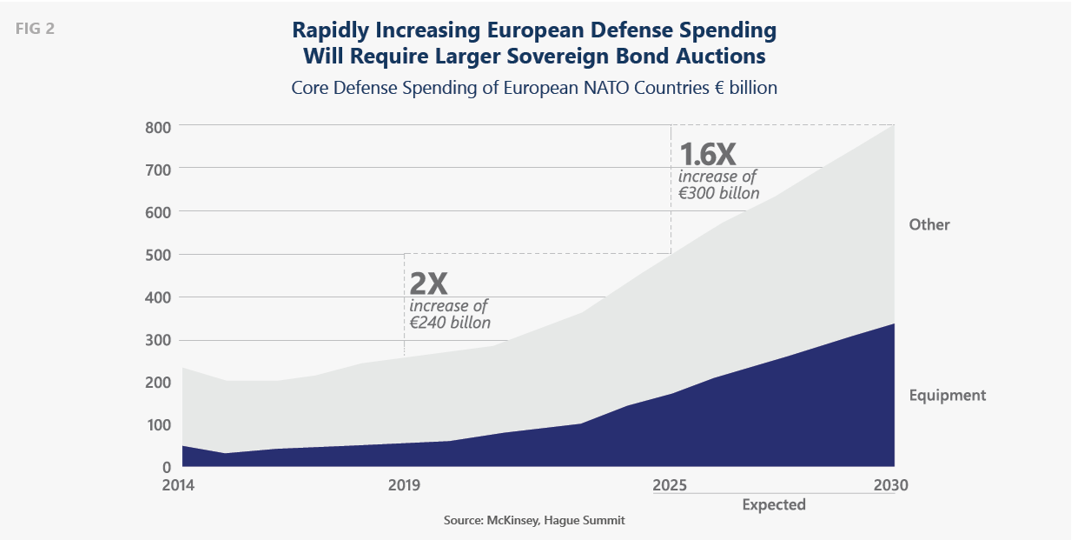
Many European countries have increased defense spending budgets significantly after years of underinvestment. The combination of the Ukraine conflict occurring right on their doorstep and pressure from the Administration to invest more in their defense capabilities has led them to a new benchmark of at least 3.5% of GDP (FIG 2). This could lead to European defense spending jumping to €800B by the end of the decade representing a €300B increase. This would be on top of a €240B increase so far this decade. With the tax base already stretched by social programs and other government expenses, most of this incremental spending has been, and will continue to be debt financed, leading to ever-growing sovereign bond auction sizes.
Here at home, the White House has proposed an almost $500B defense budget increase which, given the already large deficit, will also be largely financed in the treasury bond market and will lead to record shattering auction sizes.
Geopolitical volatility and the Administration’s efforts to reorder trade relationships, mostly through tariffs, has resulted in a wave of “reshoring” as various companies look to better secure component supply chains. One notable area is semiconductors, at the heart of the AI infrastructure spending boom. This wave, frequently described as significantly larger than the internet buildout and even the nationwide rail expansion in the 1800’s has had a profound impact on economic growth in the form of massive data center spending and on the capital markets in the form of record setting bond and equity issuance.
Innovation and technology will continue to impact markets dramatically, starting right at the top at the Fed and other central banks. While they contend with the upward price pressures driven by military conflicts, they must gauge the impact AI will have on inflation.
Many commentators, as well as new Fed Chair Warsh, believe AI will introduce a new wave of increased productivity introducing a deflationary impulse into the economy. However, in the meantime, the physical infrastructure needs of offering ever-more-powerful AI tools has driven prices up for land, electricity, water, tradesmen, chips, servers, etc.
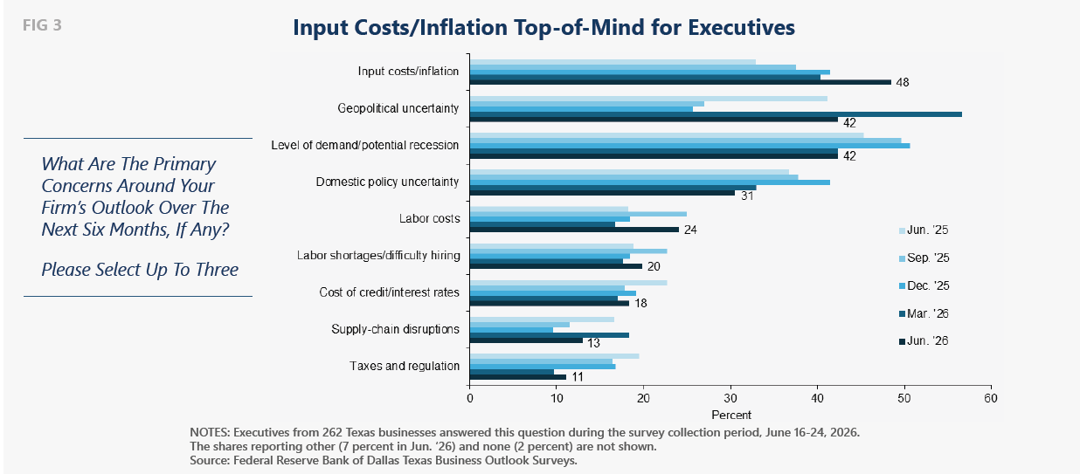
While AI may bring a productivity wave, more immediate concerns in the business community are focused on prices. A recent Federal Reserve Bank of Dallas survey (FIG 3) showed that “Input costs/inflation” moved back to the top of the list of primary concerns for executives over the next 6 months.
Uncertainty on the employment side of the Fed’s mandate also looms as some believe AI will render certain jobs obsolete leading to the roll-out of Universal Basic Income while others believe a form of Jevons Paradox* will take hold leading to many more new jobs being created than lost.
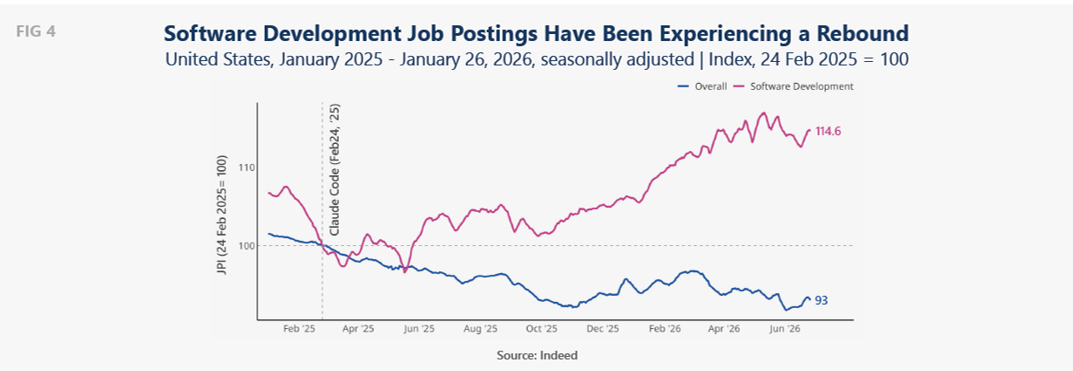
Software developer jobs were deemed highly vulnerable immediately after the launch of Claude Code last year. In fact, after an initial dip, developer job listings have been on the rise (FIG 4).
Innovation is impacting the mortgage space, making the refinancing process much cheaper and easier. This has forced investors to adjust their prepayment expectations as borrower behavior continues to evolve.
And innovation is impacting the credit space as companies incorporate AI into their operations, software budgets are encroached upon by AI token spend budgets, capital expenditure plans incorporate the new AI reality and paying for it all is leading to huge debt and equity financings.
In the second half of the year, the focus on the mid-term elections in the US will intensify. With control of the House in play and the Senate too close to call, there is potential for quite a bit of market volatility as polls ebb and flow and the Administration launches last minute policy proposals in hopes of defending both majorities. We anticipate further volatility as participants price in the results and set up for either a stalemated government or two more years of Republican control in DC.
The Two Forces Rewriting Fixed Income: Liquidity and Technology
Amidst this backdrop, we see two primary factors, liquidity and technology, impacting our three verticals, Rates, Mortgages and Credit, in many different ways.
In the Rates space, while trading liquidity is important, even more important is how the Fed manages liquidity throughout the plumbing of fixed income markets. We’ve seen the positive impacts Fed programs can have in times of stress such as the GFC and the COVID crisis. We’ve also seen the disruption and volatility that can occur when they get things wrong. Last October, the Fed allowed bank reserves to fall too low, causing funding stress in the markets. In fact, there were multiple days where funding rates traded above the Fed’s standing repo facility, which is designed to set a hard ceiling on that rate.
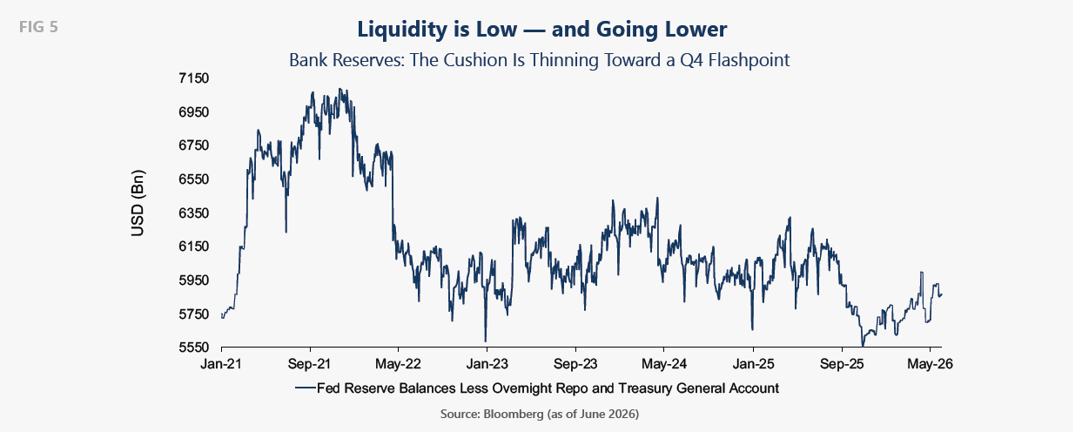
The Fed reacted by increasing reserves by $40B a month as they seek what they refer to as an “ample” level of reserves. This program was recently amended to $10B a month.
This period of funding stress was reminiscent of the Fed’s miscalculation towards the end of 2019. While the Fed attempts to avoid making misjudgments like these two again, the markets will be adjusting to a new Fed Chair who seeks to overhaul the way the Fed operates, launching five task forces to recommend changes in: Communications, Balance Sheet, Data Sources and Uses, Productivity and Jobs and Inflation Frameworks.
Warsh has made it clear he is not a fan of the dot plots and punctuated that opinion by refusing to provide forecasts of his own at the last Fed meeting. He wants to wean the market off of forward guidance and has been clear about wanting to reduce the size of the Fed’s balance sheet. The “dots”, forward guidance, running a historically large balance sheet, and other post GFC policies were all designed to suppress rate volatility. We believe that as the market adjusts to less spoon-feeding of Fed intentions, rate volatility will move in a wider range.
We also believe it will impact liquidity, especially shrinking the balance sheet. We recently saw an example of the funding pressures that could emerge in the months ahead: at quarter-end, equity funding rates became elevated, with equity total return swaps (TRS) trading approximately 140 basis points over SOFR for terms spanning the quarter-end turn. A shrinking balance sheet combined with falling bank reserves will lead to increased funding volatility, in our opinion (FIG 5).
Technology will impact rates as well through the Fed’s assessment of inflation prospects and employment. As mentioned above, the Fed will be challenged to understand how AI will potentially cause job displacement, especially in recent college graduate, entry level roles. As we have shown, displacement has been slower to occur than some feared, and some roles have actually seen growth. But as AI integration continues, productivity gains could cause certain jobs to disappear over the longer term. The Fed will attempt to anticipate this tipping point despite it not being a function of interest rates.
Analyzing AI deployment’s impact on inflation will also be a priority. General thinking is AI will be deflationary as most technological innovations have proven to be. But to date, its actually caused inflation in certain product categories, like the AI “picks and shovels” mentioned above. The Fed assumes the daunting task of identifying the point where these initial inflationary impulses flip over to the point where productivity gains create deflation or at least disinflation. This will be a very big question for the Fed and market participants and should impact rates and rate volatility.
Our Rates teams, trading in treasury futures basis and arbitrage strategies in coupon curve, cross sovereign and inflation will try to take advantage of this dynamic environment filled with uncertainties that have not confronted a Fed, or rates investors before. We believe this is an ideal environment for relative value (RV) trading of the types our teams do. And several of our Teams will be seeking to exploit inefficiencies along rates curves as markets attempt to digest ever-growing sovereign supply.
Moving to the mortgage space, the same two themes, technology and liquidity will impact the opportunity set.
We will start with technology. Historically, if you wanted to refinance your mortgage, you would call your mortgage banker, set up an appointment, go down to the bank, fill out all the documentation and wait. The process could take weeks or longer and, in some cases, if rates moved quickly you might miss the opportunity entirely, a frustrating prospect.
Fast forward to today and borrowers can initiate a refinancing with the lender app on their phone or by responding to an email. This has led the S-curve, a reflection of prepayment behavior at certain “incentive buckets”, meaning changes in mortgage rates, to steepen as borrowers respond more quickly to rate changes (FIG 6).
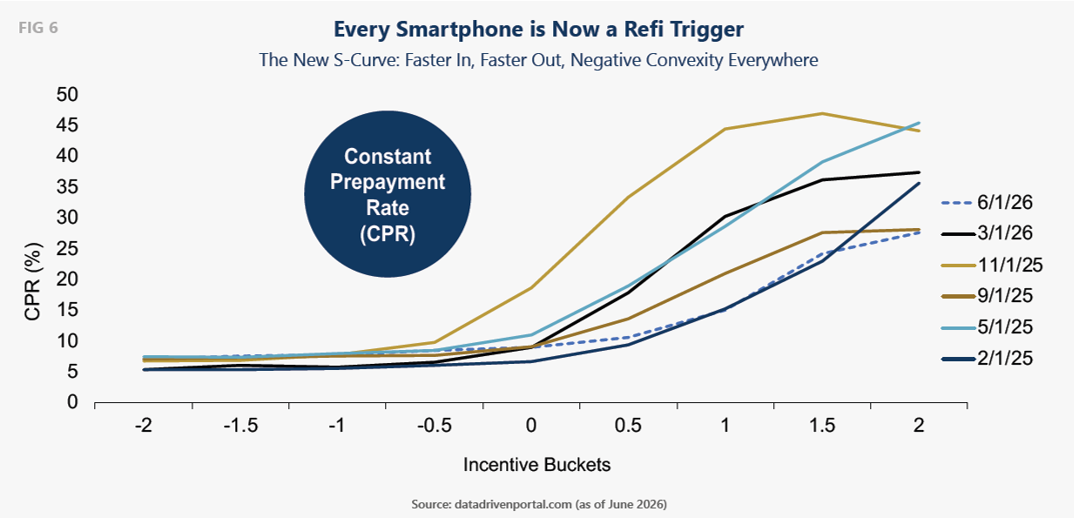
Prepayment behavior and borrower sensitivity to changes in rates is a primary focus for agency mortgage traders. What are prepayments going to be, and how will changes in rates impact prepayments? Understanding and anticipating changes in prepayments is a critical piece of the mortgage puzzle and understanding how technology is impacting borrower behavior will remain paramount.
Moving to liquidity, it has been a big story this year in the non-agency mortgage and ABS spaces.
As an example, asset backed securities and issuance by hyperscalers in the asset backed space, has been dramatic this year. New issue volumes are already 50% higher than they were last year, on pace to dwarf last year's issuance. This pace shows no signs of slowing as very ambitious plans for data center and related infrastructure build require literally hundreds of billions of capital over the coming years. This has been a fruitful area for trading and investing for our teams and we believe this will continue through H2.
We have several teams operating in our Mortgage sleeve trading agency and non-agency mortgage product, Credit Risk Transfer (CRT), Asset Backed Securities (ABS), and Residential Transition Loans (RTL). In the second half, we see volatility in rates, volatility in mortgage prepayments, especially as technology increases the efficiency of that option, and massive issuance creating attractive opportunities, both long and short, in the mortgage space.
Now Credit, where liquidity and technology have had, and will likely continue to have, the largest impact of our three focus areas. Starting with liquidity, an important challenge our investor base has confronted in recent years is the much-slower-than-anticipated return of capital from allocations to private equity and private credit. The investment vehicles in which these strategies are typically pursued offer very limited or no redemption rights leaving investors to wait for realizations and distributions that are under the sole discretion of the manager. This indigestion in the private capital ecosystem has led investors to seek liquidity elsewhere in the form of secondary sales and continuation vehicles and to, in some cases, rethink allocation amounts to illiquid strategies in favor of those offering competitive returns on a risk and liquidity-adjusted basis. Said simply, revisiting the way they value liquidity.
Another important aspect of liquidity in credit intersects with technology, and has been the explosion in hyperscaler issuance in the investment grade (IG) corporate bond market, already approaching $200B year to date. In fact, there have been seven IG deals of at least $25B year to date versus only one of that size last year. Massive borrowing by previous cash cows like Google and Meta is having a profound impact on sector credit spreads, corporate credit curves and even equity valuations as well as liquidity throughout fixed income. This disruption has provided attractive trading opportunities and will continue to do so, in our opinion. We believe this level of borrowing is only in the 2nd or 3rd inning.
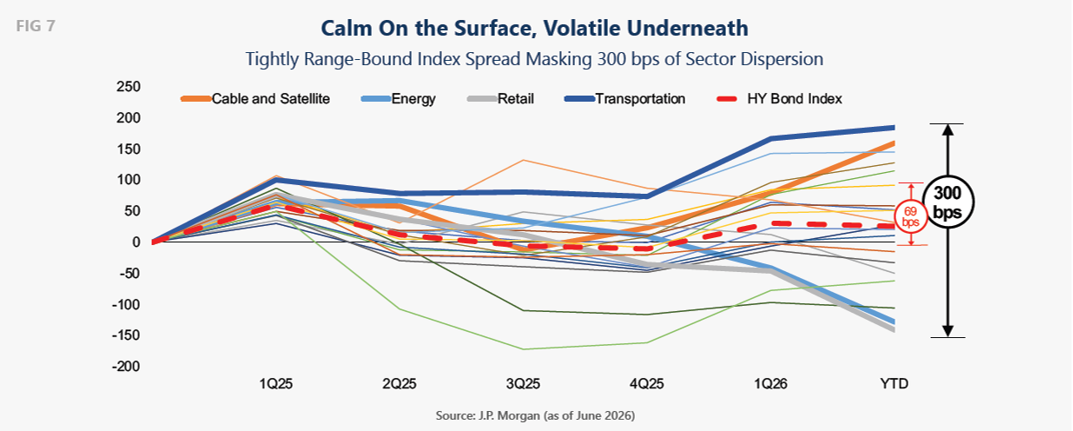
Liquidity challenges from the lack of distributions and record-breaking issuance combined with the Fed trying to reduce its balance sheet and manage bank reserves has led to pricing dislocations and dispersion. In high yield credit, for example, using the JP Morgan High Yield Index (FIG 7), we can see that while the index spread has traded in a range of only 69 basis points since Q1 ‘25, individual sector performance has spanned 300 basis points. For our managers who are typically long and short, this amount of dispersion displayed by outperformers/tighteners and underperformers/wideners provides opportunity.
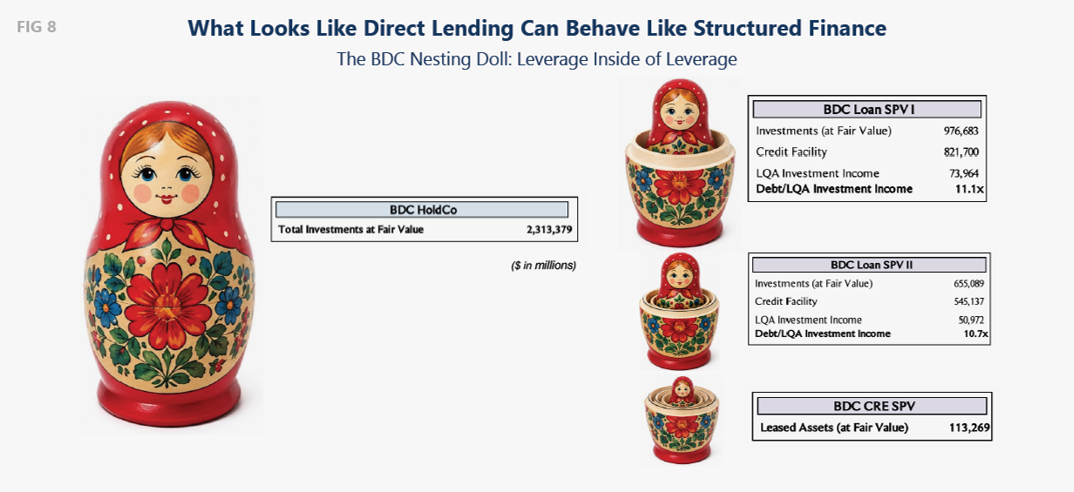
Financial technology/innovation, more frequently called financial engineering, that was designed to manufacture yield in a decade of low interest rates is not aging well in the higher-for-longer rate environment in which we have been operating. An example getting lots of attention has been business development companies (BDCs). BDCs were designed as non-bank lenders to middle market borrowers. In early days they were essentially books of loans that could be levered 2 to 1. Over time, special purpose vehicles (SPVs) and collateralized loan obligations (CLOs) were added leading to our nesting doll representation below using a representative publicly traded BDC’s disclosures (FIG 8).
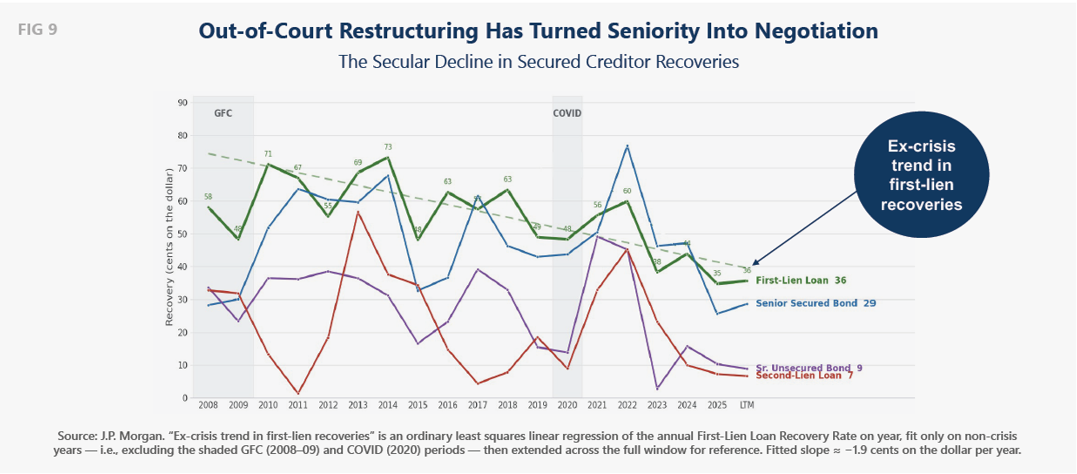
Another form of financial “innovation” making an impact is liability management exercises (LMEs). Years ago, bankruptcy law innovation gave us the prepackaged bankruptcy, or prepack, designed to prevent creditors from the same lender class from trying to get an advantage over those similarly situated. In recent years, LMEs have proliferated, which allows for exactly that. This risk of disproportionate recovery for certain lenders has contributed, along with the growth in “loan-only” capitalizations and historically high levels of allowed leverage, to a secular decline in recovery rates (FIG 9).
All of this leads us to the following conclusion. We are circumspect about financial engineering and bullish on real-world engineering.
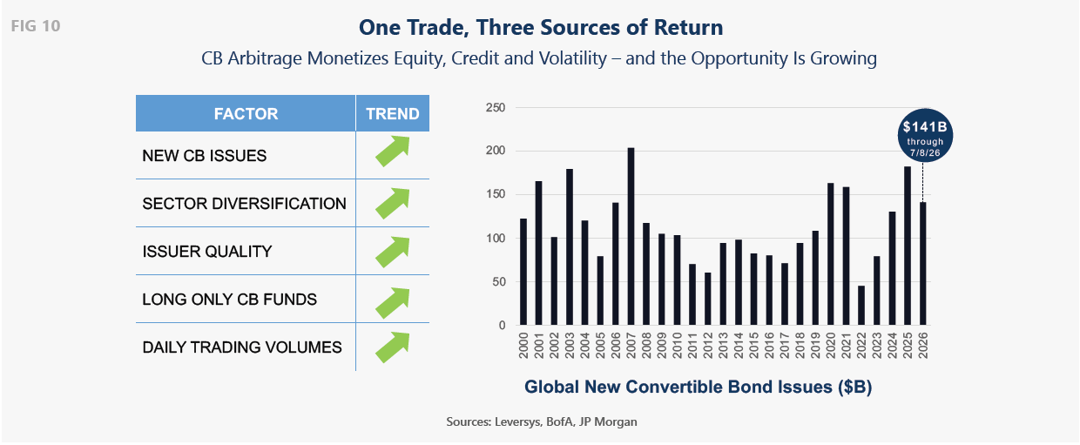
We see an area we added in the last year, convertible bonds, as likely to continue providing very attractive trading opportunities. This rapidly growing market has seen new issuance top $140B year to date, a pace that if maintained would set a record topping the previous one set in 2007. This asset class, perceived by some as “niche”, actually has over $700B outstanding and its average daily trading volume is $5B, almost half of US high yield daily trading volume (FIG 10).
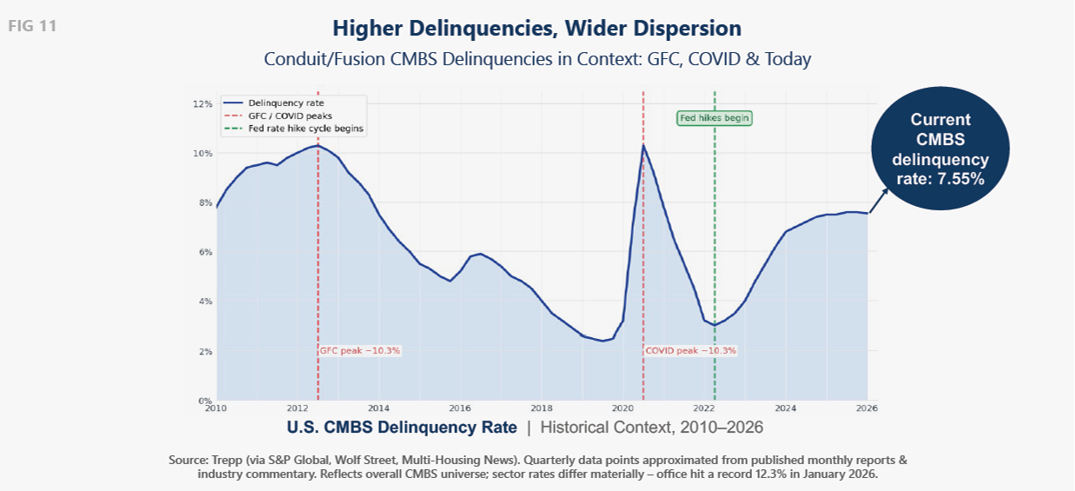
Another area in Credit likely to continue providing attractive opportunities is CMBS, an asset class that has been grappling with a wave of challenges over the last five years. COVID forced work-from-home, creating occupancy rate uncertainty, then the 2022 Fed hiking cycle repriced capitalization (cap) rates downward almost overnight, jeopardizing refinancing opportunities. Then tariffs and a renewed rise in inflation hit commercial real estate through higher insurance rates, labor and material costs and other operating cost increases. Property owners would normally hope for lower costs to partly offset lower cap rates but instead they were hit on both sides. Above (FIG 11), we can see delinquencies since 2010, highlighting the COVID spike, brief period of recovery and rise back to the elevated plateau currently around 7.5%.
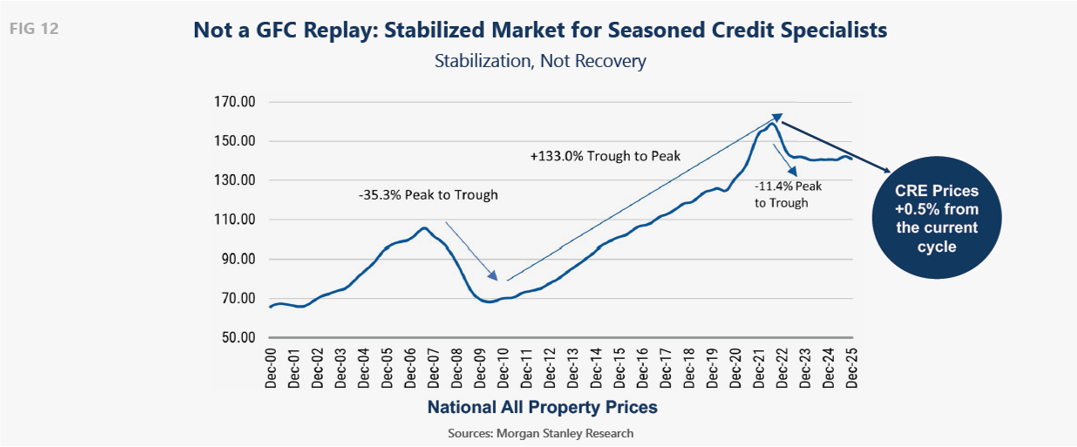
A key difference between today and the record setting delinquency environment during the GFC is that average property price declines have been muted in comparison. Whereas they dropped by over 35% during the GFC, while delinquencies and headlines cause many to think this recent period is comparable, in fact CRE prices have dropped by roughly 11% from the recent peak (FIG 12).
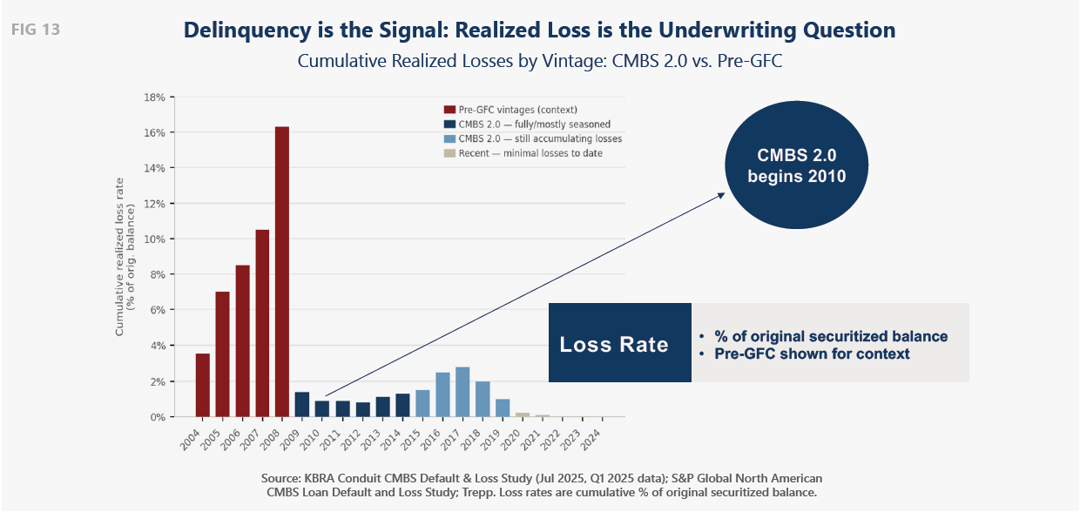
Another way of highlighting the difference between 2007 to 2009, what we refer to as CMBS 1.0, and the post GFC period, CMBS 2.0, is realized loss rate. While cumulative realized losses reached over 16% in 2008, in only two years since 2010 have losses breached 2%. The misperceptions about the recent challenges in CRE have caused liquidity gaps and exploitable pricing dislocations in CMBS and have provided a rich opportunity set which we believe will persist (FIG 13).
In summary, liquidity and technology have been impacting each of Mariner’s focus areas, Rates, Mortgages and Credit. We are fortunate to be operating in an environment that favors relative value strategies that seek to benefit on both the long and short side. The second half of 2026 is bound to be an exciting, opportunity rich environment we look forward to navigating.
If you'd like to hear E.G. Fisher and a panel of specialist PMs discuss these themes in their own words, the mid-year webcast replay is available on demand here.
*William Stanley Jevons – The Coal Question, 1865. Jevons observed that more efficient steam engines dramatically boosted coal usage, rather than reduce it.